Your board gets a packet before every meeting. Somewhere in that packet is a data section with financials, program numbers, maybe a donor update. Half the board reads it carefully. Half skims it. A few people ask questions. The ED answers as best they can.
And then everyone moves on.
If that sounds familiar, the problem probably isn't your board. It's the report.
Most nonprofit data reports aren't built to be understood. They're built to be comprehensive. There's a difference, and it matters.
What most board reports get wrong
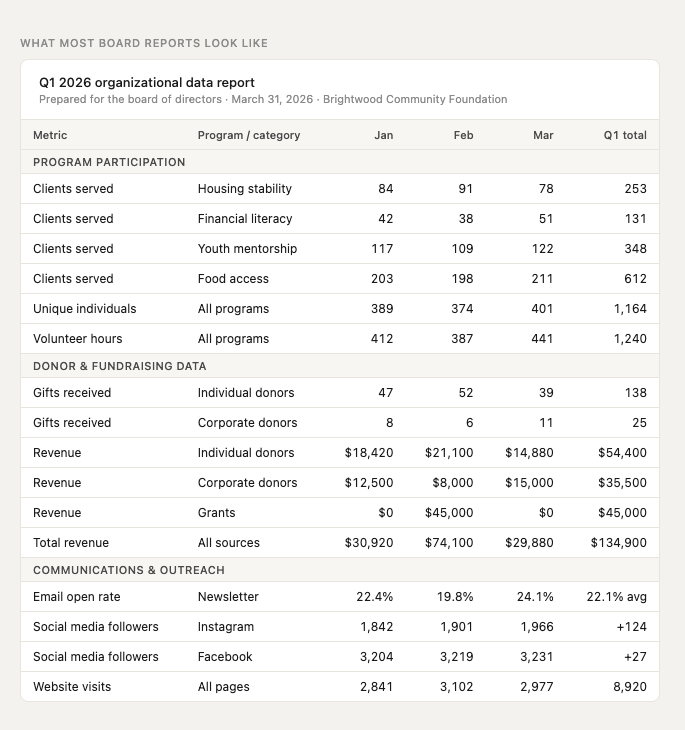
The typical nonprofit board report is a data dump. Every number the organization tracks, organized by department or program, formatted in a table, dropped into a PDF.
It answers the question "what happened?" But it doesn't answer the questions board members are actually asking, which are: Are we on track? Should we be worried about anything? Is our money working?
A board member who isn't a data expert, which is most of them, can't answer those questions from a table of raw numbers. So they either ask the ED to interpret everything in real time, or they nod along without really understanding what they're looking at.
Neither is a good use of your board meeting.
What a useful board report actually looks like
A good board report does three things: it tells a story, it flags what matters, and it fits in the time your board has to read it.
It tells a story. Numbers without context aren't information. "We served 340 people this quarter" doesn't mean much if the board doesn't know whether that's up or down, whether it's on pace for your annual goal, or how it compares to the same period last year. Every number in your report should come with enough context to be meaningful.
It flags what matters. Your board doesn't need to see every metric you track. They need to see the three or four indicators that tell them whether the organization is healthy. Pick those indicators deliberately, track them consistently, and make sure they're front and center.
It respects the time available. If your data section takes more than five minutes to read, it won't get read. One page of well-chosen numbers beats six pages of comprehensive tables every time.
A simple structure that works
Here's a framework that works for most small and mid-sized nonprofits.
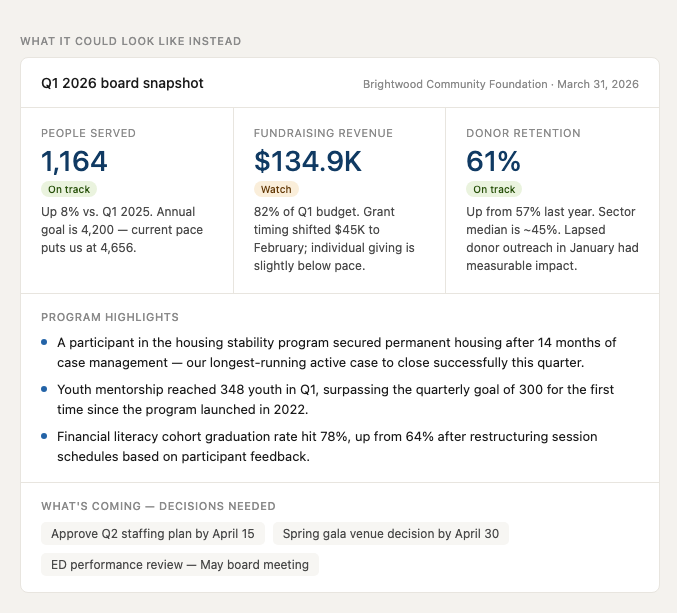
Lead with the headline numbers. Two or three metrics that answer "how are we doing?" at a glance. For most organizations: people served (vs. goal and vs. last year), fundraising revenue (vs. budget), and donor retention rate. Big font, prominent placement.
Add brief context for each. One or two sentences under each number: what's driving it, whether it's on track, anything the board should know.
Follow with program highlights. Two or three specific stories or outcomes from the quarter. Not just counts but your actual impact. A program participant who got housed. A school that improved its outcomes. Something that connects the numbers to the mission.
Close with what's coming. What decisions does the board need to make? What should they be watching next quarter? This section makes the report useful, not just informational.
That's it. One page or two at most, depending on your organization's complexity.
The role of data quality
A report is only as good as the data behind it.
If your donor retention number is built from a database with thousands of duplicates, it's not a real number. If your program participation data is collected inconsistently across sites, the trend line isn't telling you what you think it is.
Data quality and reporting aren't separate problems. Organizations that invest in clean, consistent data don't just have better systems. They have better board meetings. Their leaders walk in with confidence instead of caveats. Their boards make decisions instead of asking for clarification.
Start with what you have
You don't need a dashboard platform or a data analyst to build a better board report. You need clear decisions about what to measure, a consistent process for collecting it, and a simple format that makes it readable.
If you're not sure where your data stands, our free Nonprofit Data Health Checklist is a good place to start. It takes about 10 minutes and will show you exactly where the gaps are.
Download the free Nonprofit Data Health Checklist →
When you're ready to talk through what better reporting could look like for your organization, I'm happy to do a free 30-minute discovery call.
Joshua Barillas is the founder of Prismatic Consulting, a data services firm built exclusively for nonprofits. Learn more about our services or get in touch at hello@prismaticconsulting.us.